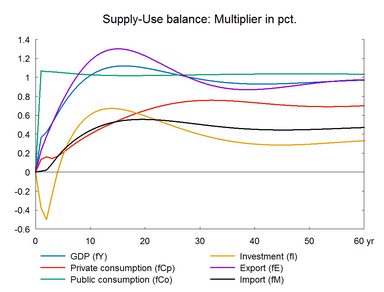
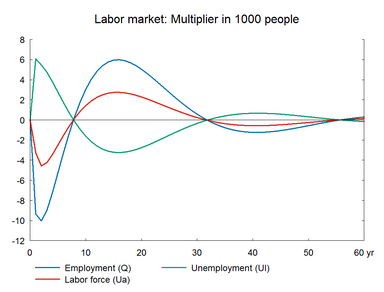
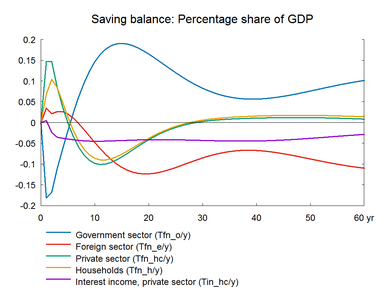
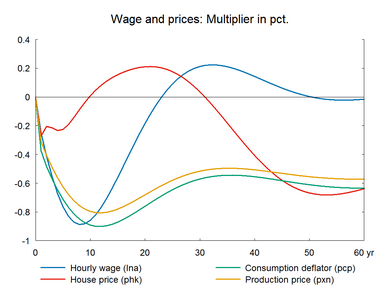
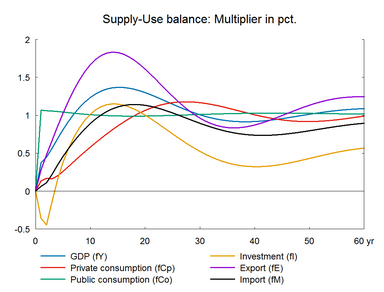
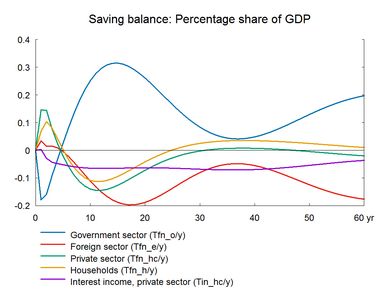
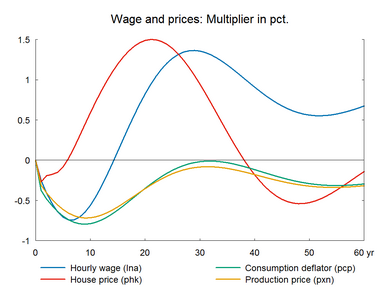
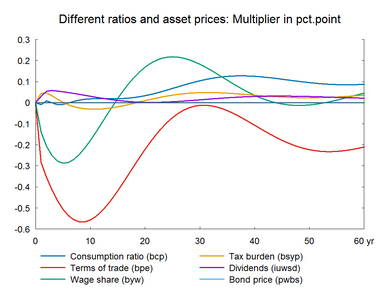
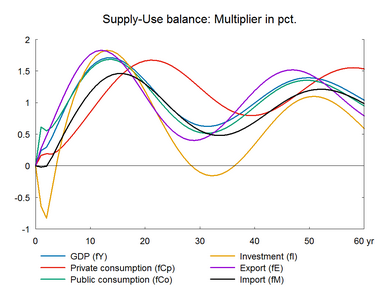
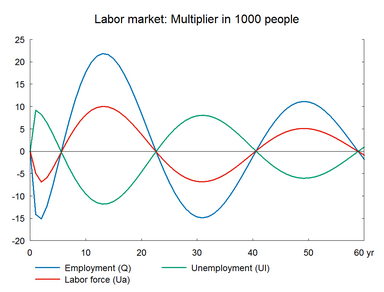
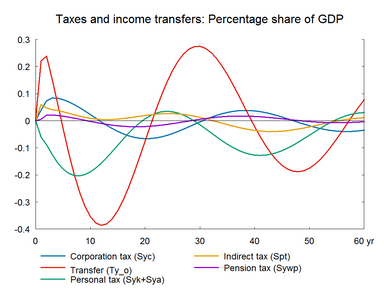
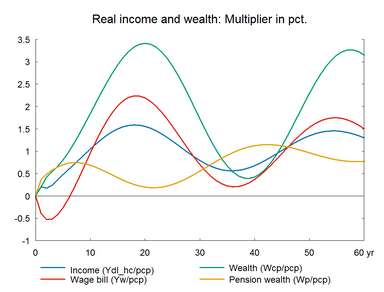
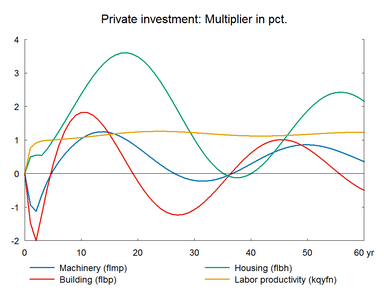
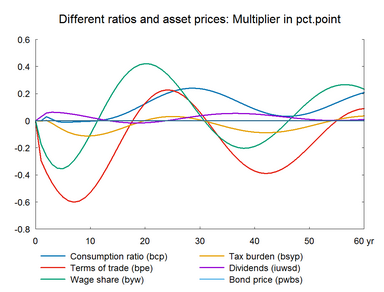
Here the efficiency of capital and labor is increased, which leads to a fall in the demand for both factors. The experiment produces a general reduction in production costs, therefore, a long run gain in foreign trade and domestic production.
The efficiency of labor and capital is permanently raised by 1 percent . (See experiment)
Table 13a. The effect of a permanent increase in labor and capital efficiency
1. yr
2. yr
3. yr
4. yr
5. yr
10. yr
15. yr
20. yr
25. yr
30. yr
Million 2010-Dkr.
Priv. consumption
fCp
1203
1271
1027
1238
1662
4182
6652
8999
10899
12117
Pub. consumption
fCo
5824
5885
5962
6028
6086
6390
6800
7313
7909
8571
Investment
fI
-1847
-2675
-1450
-251
702
3351
4200
4101
3597
3014
Export
fE
2940
4910
6730
8551
10278
17212
20290
20137
18582
17349
Import
fM
62
75
824
1738
2581
5883
7980
8993
9239
9124
GDP
fY
7855
9039
11192
13622
16024
25238
29993
31633
31870
32078
1000 Persons
Employment
Q
-9,33
-10,09
-9,08
-7,31
-5,27
3,43
6,51
5,35
2,59
0,08
Unemployment
Ul
5,44
5,11
4,55
3,67
2,66
-1,76
-3,39
-2,82
-1,39
-0,07
Percent of GDP
Pub. budget balance
Tfn_o/Y
-0,18
-0,18
-0,13
-0,09
-0,05
0,13
0,19
0,16
0,12
0,07
Priv. saving surplus
Tfn_hc/Y
0,10
0,12
0,08
0,04
0,00
-0,09
-0,08
-0,05
-0,02
0,00
Balance of payments
Enl/Y
-0,07
-0,06
-0,05
-0,05
-0,04
0,05
0,11
0,12
0,09
0,07
Foreign receivables
Wnnb_e/Y
0,07
0,08
0,05
0,02
-0,02
-0,01
0,28
0,65
0,96
1,16
Bond debt
Wbd_os_z/Y
0,23
0,43
0,56
0,64
0,67
0,24
-0,59
-1,30
-1,70
-1,82
Percent
Capital intensity
fKn/fX
-0,37
-0,48
-0,60
-0,71
-0,79
-0,97
-0,90
-0,73
-0,58
-0,48
Labour intensity
hq/fX
-0,67
-0,76
-0,83
-0,88
-0,91
-0,95
-0,94
-0,94
-0,95
-0,95
User cost
uim
-0,36
-0,42
-0,47
-0,53
-0,57
-0,66
-0,57
-0,43
-0,31
-0,25
Wage
lna
-0,25
-0,41
-0,55
-0,68
-0,78
-0,86
-0,50
-0,07
0,23
0,34
Consumption price
pcp
-0,37
-0,47
-0,56
-0,63
-0,70
-0,87
-0,83
-0,69
-0,56
-0,49
Terms of trade
bpe
-0,29
-0,36
-0,42
-0,48
-0,53
-0,63
-0,58
-0,47
-0,38
-0,33
Percentage-point
Consumption ratio
bcp
0,02
0,04
0,02
0,01
0,01
0,03
0,03
0,03
0,04
0,06
Wage share
byw
-0,13
-0,19
-0,24
-0,27
-0,28
-0,22
-0,08
0,02
0,06
0,05
(See details)
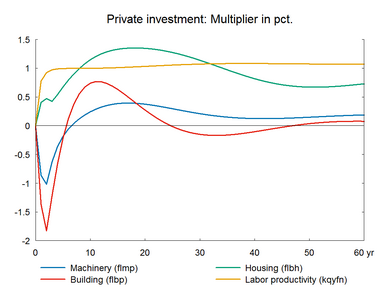
Higher efficiency of labor and capital means that both factor inputs can be reduced, consequently investment and employment fall in the short term. The fall, particularly in machinery investment, reduces imports and depreciation, which increases gross operating surplus. As factors' efficiency increases, prices fall and net exports increase without relying on change in wages. Higher net exports increase production and employment. This offsets the initial fall in employment created by the increase in labor efficiency.
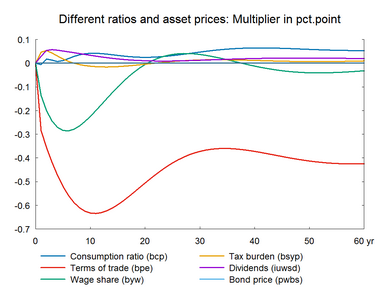
The initial fall in employment pushes wages and prices downward. This improves competitiveness and induce exports to rise even more. As in the previous experiment, the combined effect of higher efficiency and lower wages means that the short-term decrease in factor utilization disappears relatively quickly and the initial negative impact on employment is reversed quickly. In the long term, capital intensity and labor intensity fall by approximately 1 percent, excluding the housing sector.
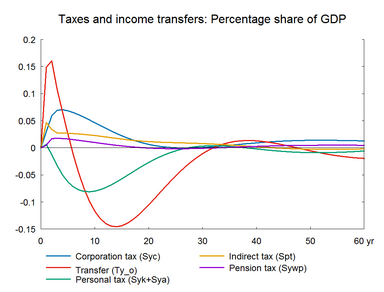
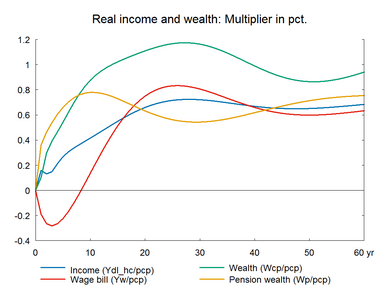
There is a small positive impact on private consumption in the long run, due to the positive impact on real disposable income, which is stimulated as the higher productivity increases the real income of transfer recipients. The public budget improves in the long term.
Figure 13a. The effect of a permanent increase in labor and capital efficiency
The experiment in section A is repeated accompanied by improved export performance. (See experiment)
Table 13b. The effect of a permanent increase in labor and capital efficiency, with supply effects
1. yr
2. yr
3. yr
4. yr
5. yr
10. yr
15. yr
20. yr
25. yr
30. yr
Million 2010-Dkr.
Priv. consumption
fCp
1206
1341
1224
1614
2261
6468
11109
15289
18025
18900
Pub. consumption
fCo
5823
5877
5943
5997
6040
6251
6586
7084
7727
8469
Investment
fI
-1763
-2398
-906
550
1780
5806
7403
7068
5589
3842
Export
fE
3584
6167
8661
11230
13738
24188
28279
26059
20835
16537
Import
fM
681
1127
2422
3935
5414
12066
16563
18197
17505
15798
GDP
fY
7966
9587
12257
15264
18297
30674
36923
37512
34972
32291
1000 Persons
Employment
Q
-9,26
-9,65
-8,15
-5,82
-3,17
8,44
12,20
8,98
2,82
-2,55
Unemployment
Ul
5,40
4,86
4,04
2,87
1,54
-4,39
-6,39
-4,74
-1,53
1,30
Percent of GDP
Pub. budget balance
Tfn_o/Y
-0,18
-0,18
-0,11
-0,06
0,00
0,25
0,33
0,28
0,18
0,08
Priv. saving surplus
Tfn_hc/Y
0,10
0,12
0,07
0,03
-0,01
-0,13
-0,13
-0,09
-0,05
-0,02
Balance of payments
Enl/Y
-0,07
-0,05
-0,04
-0,03
-0,01
0,12
0,20
0,18
0,12
0,06
Foreign receivables
Wnnb_e/Y
0,06
0,07
0,04
0,01
-0,01
0,16
0,74
1,44
1,97
2,26
Bond debt
Wbd_os_z/Y
0,23
0,42
0,52
0,55
0,52
-0,37
-1,79
-2,96
-3,50
-3,47
Percent
Capital intensity
fKn/fX
-0,39
-0,52
-0,66
-0,79
-0,90
-1,12
-0,97
-0,65
-0,35
-0,18
Labour intensity
hq/fX
-0,69
-0,79
-0,87
-0,93
-0,97
-1,04
-1,05
-1,04
-1,03
-1,03
User cost
uim
-0,36
-0,42
-0,48
-0,53
-0,57
-0,60
-0,40
-0,12
0,07
0,13
Wage
lna
-0,25
-0,41
-0,54
-0,64
-0,72
-0,53
0,24
1,04
1,51
1,53
Consumption price
pcp
-0,37
-0,47
-0,55
-0,62
-0,68
-0,76
-0,55
-0,25
-0,01
0,08
Terms of trade
bpe
-0,29
-0,36
-0,42
-0,47
-0,51
-0,55
-0,39
-0,16
0,00
0,04
Percentage-point
Consumption ratio
bcp
0,02
0,03
0,01
-0,01
-0,01
0,01
0,02
0,05
0,09
0,13
Wage share
byw
-0,13
-0,20
-0,25
-0,27
-0,28
-0,17
0,05
0,21
0,25
0,20
(See details)
Figure 13b. The effect of a permanent increase in labor and capital efficiency, with supply effects
The experiment in section B is repeated, where the income tax rates are reduced to balance the public budget. (See experiment)
Table 13c. The effect of a permanent increase in labor and capital efficiency, with supply effects, balanced budget
1. yr
2. yr
3. yr
4. yr
5. yr
10. yr
15. yr
20. yr
25. yr
30. yr
Million 2010-Dkr.
Priv. consumption
fCp
1387
1398
1208
1642
2456
9041
17228
22956
23124
18419
Pub. consumption
fCo
3379
3100
3467
4167
5037
9515
11189
9302
5965
4114
Investment
fI
-3066
-4240
-2126
97
2053
8915
11013
8216
2900
-1249
Export
fE
3526
6158
8820
11642
14448
25546
26434
18176
9080
7421
Import
fM
-227
-177
1387
3370
5408
15259
21193
20455
14839
9323
GDP
fY
5286
6343
9774
14032
18537
37848
44911
38631
26755
19784
1000 Persons
Employment
Q
-13,96
-15,00
-12,38
-8,20
-3,37
17,58
21,00
8,39
-7,84
-15,92
Unemployment
Ul
8,14
7,59
6,10
3,98
1,54
-9,17
-10,98
-4,44
4,04
8,30
Percent of GDP
Pub. budget balance
Tfn_o/Y
-0,14
-0,14
-0,09
-0,04
0,00
0,20
0,23
0,12
-0,03
-0,11
Priv. saving surplus
Tfn_hc/Y
0,10
0,13
0,08
0,03
-0,02
-0,15
-0,17
-0,13
-0,06
0,00
Balance of payments
Enl/Y
-0,04
0,00
-0,01
-0,01
-0,01
0,04
0,05
-0,02
-0,10
-0,11
Foreign receivables
Wnnb_e/Y
0,21
0,30
0,29
0,23
0,16
-0,17
-0,26
-0,20
-0,14
-0,07
Bond debt
Wbd_os_z/Y
0,26
0,44
0,52
0,53
0,48
-0,43
-1,66
-2,29
-2,04
-1,24
Percent
Capital intensity
fKn/fX
-0,29
-0,42
-0,62
-0,80
-0,96
-1,30
-0,95
-0,30
0,18
0,21
Labour intensity
hq/fX
-0,73
-0,84
-0,92
-0,96
-0,99
-1,00
-0,98
-1,01
-1,06
-1,09
User cost
uim
-0,42
-0,53
-0,62
-0,68
-0,73
-0,61
-0,12
0,32
0,39
0,11
Wage
lna
-0,29
-0,52
-0,72
-0,87
-0,95
-0,41
1,08
2,24
2,29
1,38
Consumption price
pcp
-0,38
-0,51
-0,61
-0,70
-0,76
-0,74
-0,27
0,22
0,40
0,18
Terms of trade
bpe
-0,30
-0,39
-0,47
-0,53
-0,57
-0,53
-0,17
0,17
0,26
0,06
Percentage-point
Consumption ratio
bcp
0,04
0,05
0,02
0,00
-0,01
-0,02
0,03
0,15
0,25
0,25
Wage share
byw
-0,17
-0,25
-0,31
-0,34
-0,35
-0,10
0,28
0,45
0,31
0,03
(See details)
Figure 13c. The effect of a permanent increase in labor and capital efficiency, balanced budget
